About
Contributions
Leading the design effort from MVP to iterations, fostering successful rollouts.
Mentoring a junior designer on user research and design collaborations.
Impact
Being highlighted at the product keynote at Splunk's annual conference, receiving customer interest from 10 companies and strengthening Splunk's leadership in security analytics.
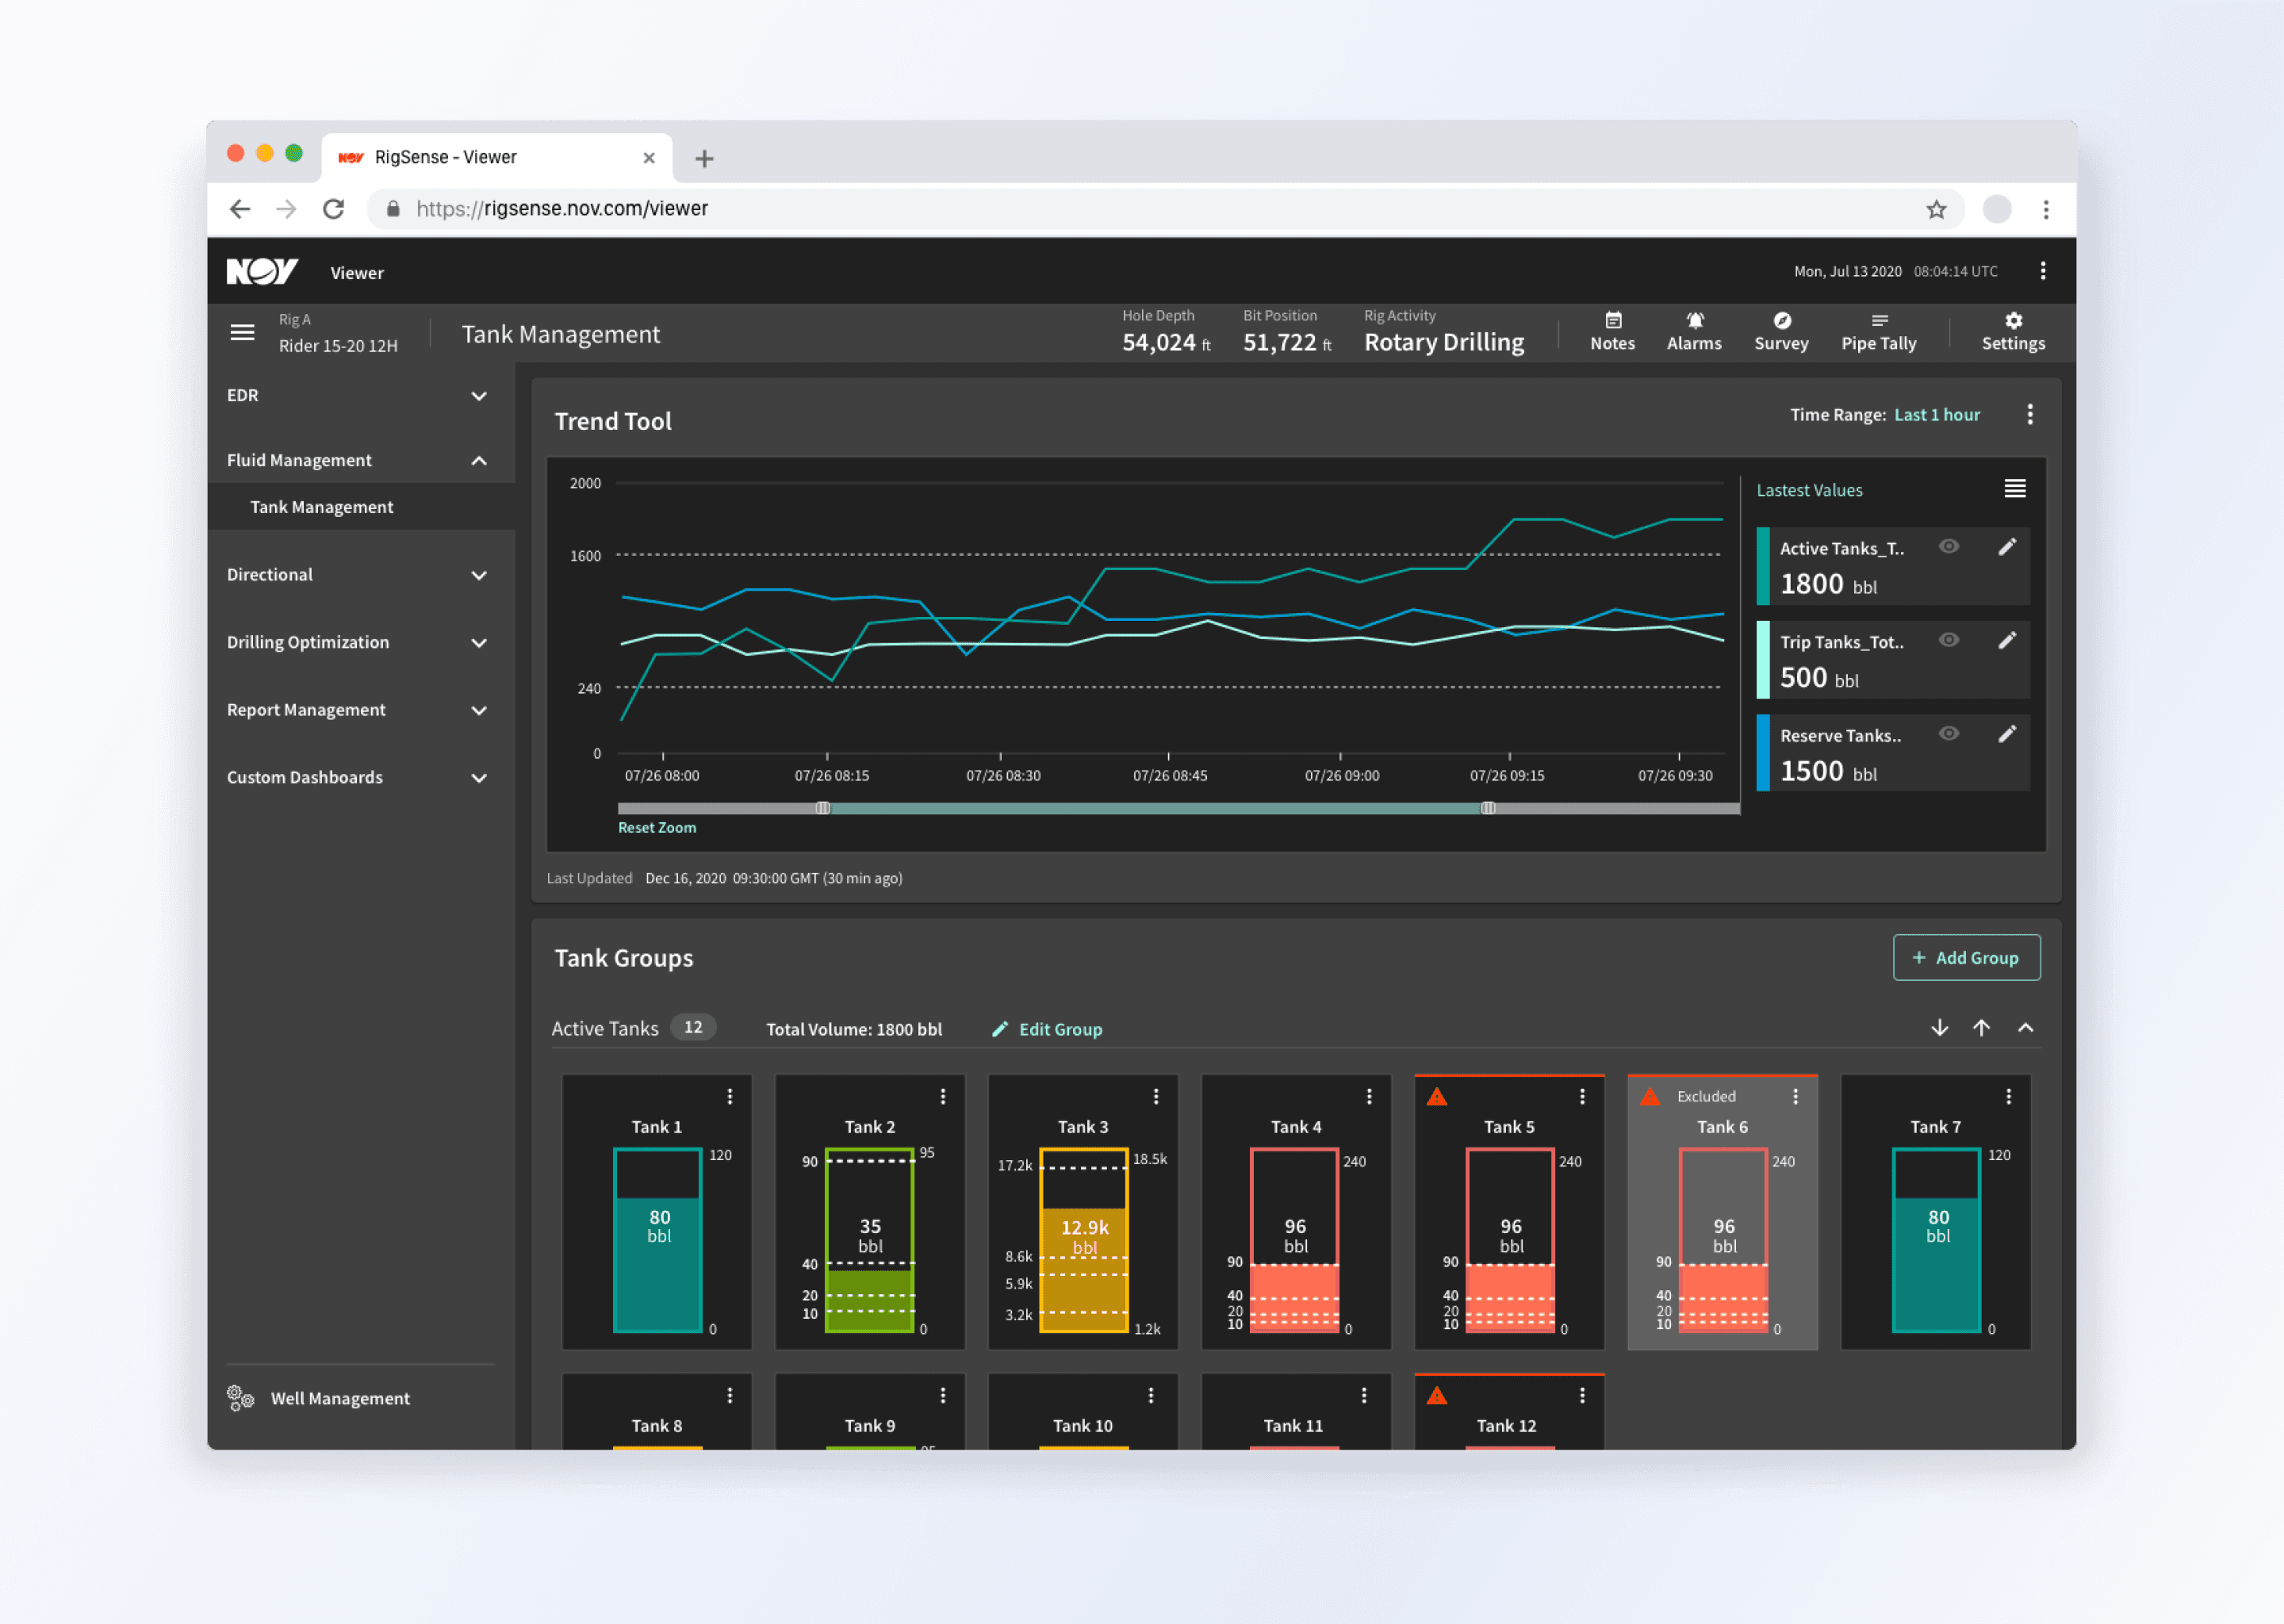
Enable users to run search and analytics across various external data sources.


Fragmented experience that takes at least 9 steps to complete, only for querying a single dataset.
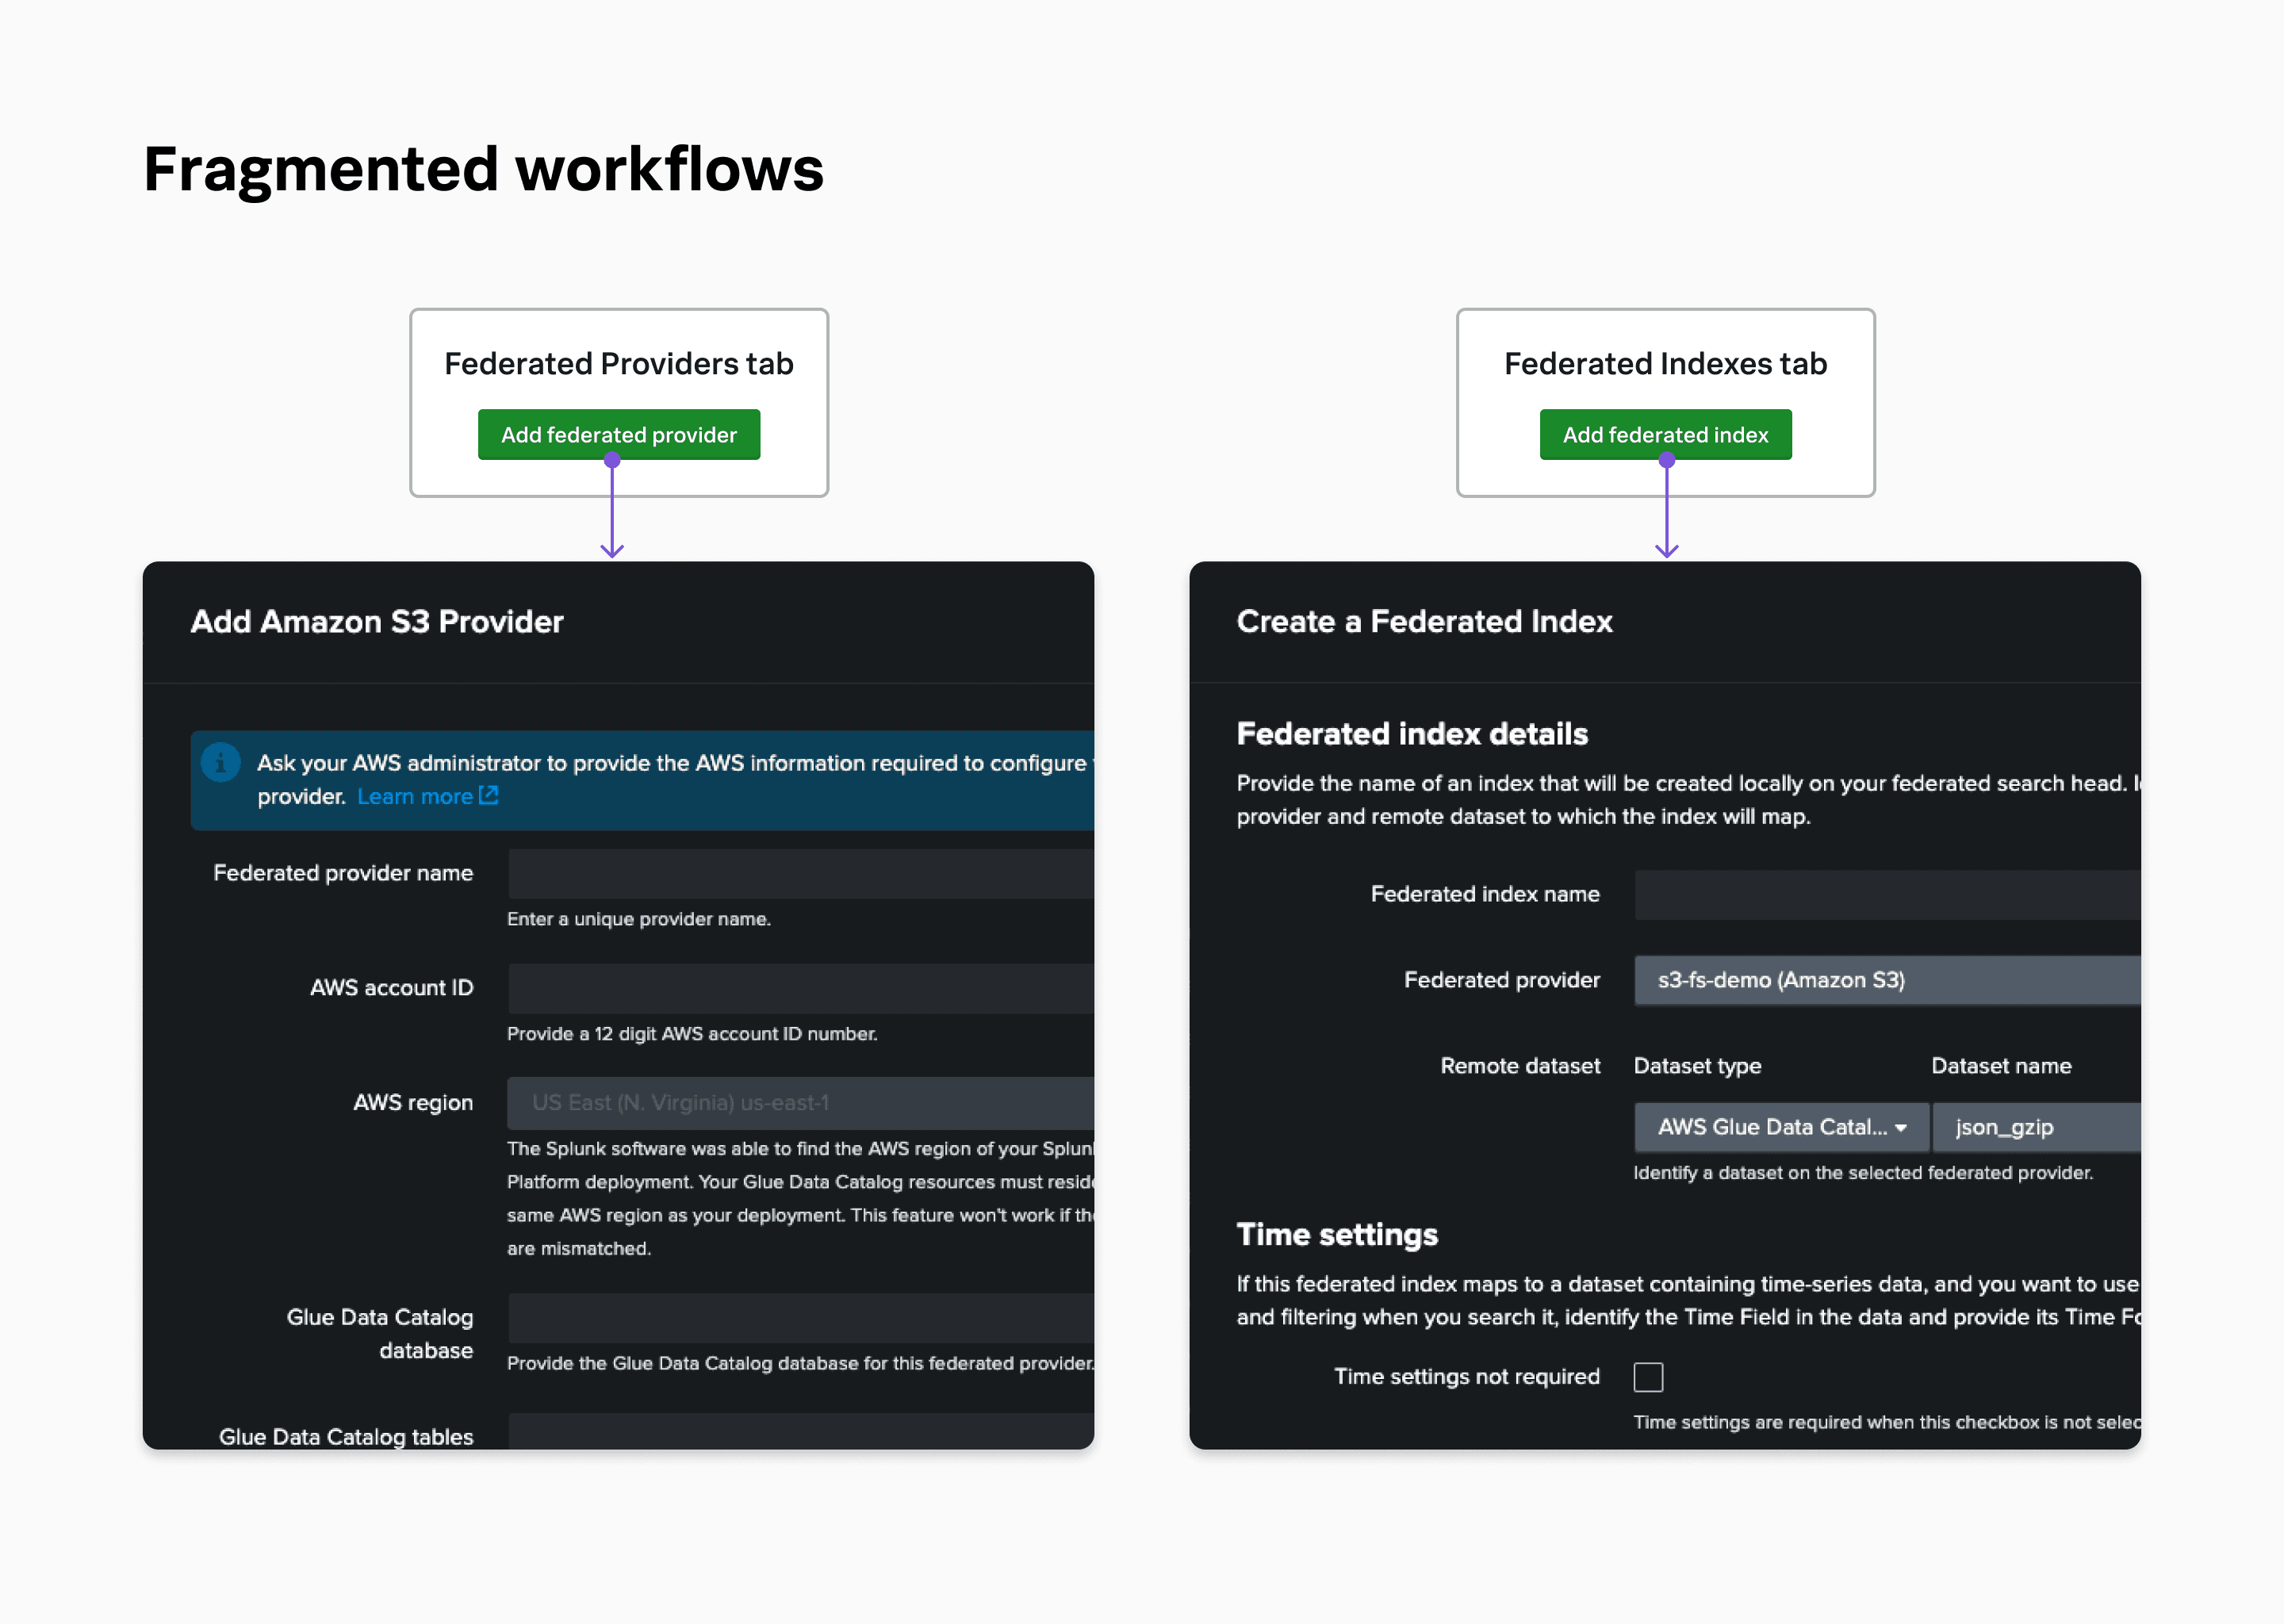
Overwhelming setup process with fragmented workflows
Two separate flows with different entry points. Each flow features a lengthy form with overwhelming settings.
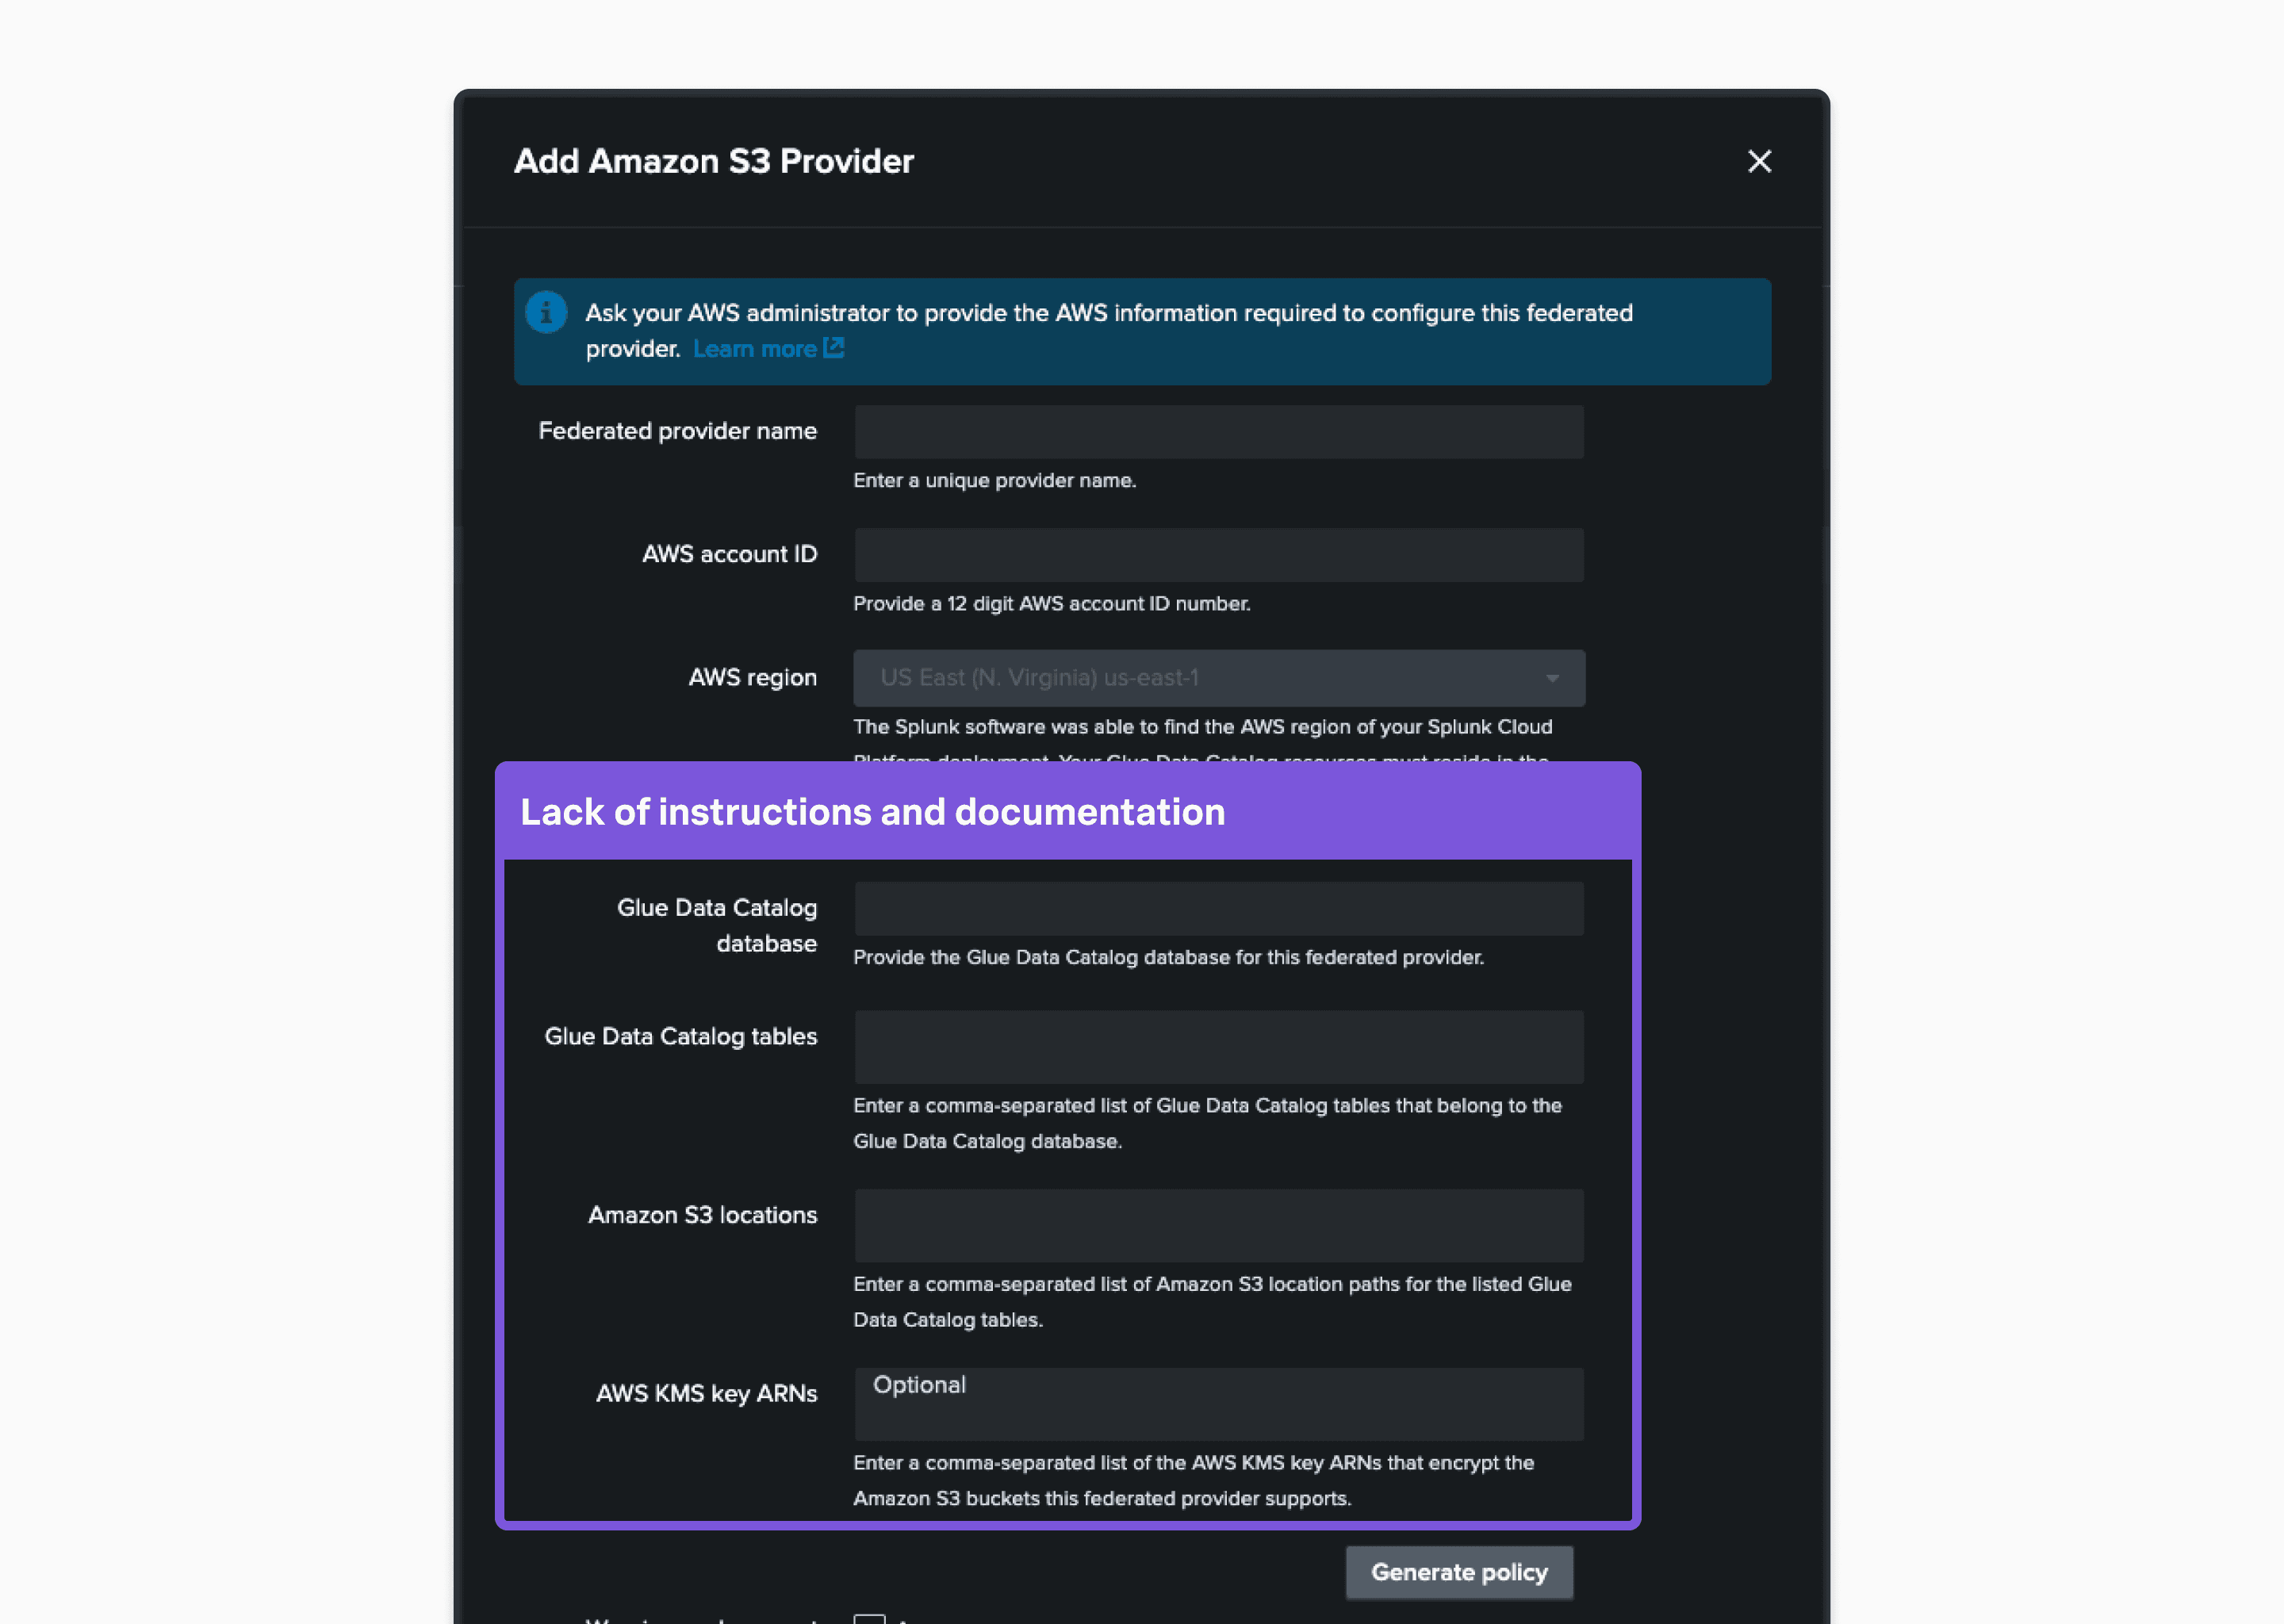
Limited guidance complicates the configuration
The lack of guidance and help text on the UI makes it hard for users to know what to do and why.
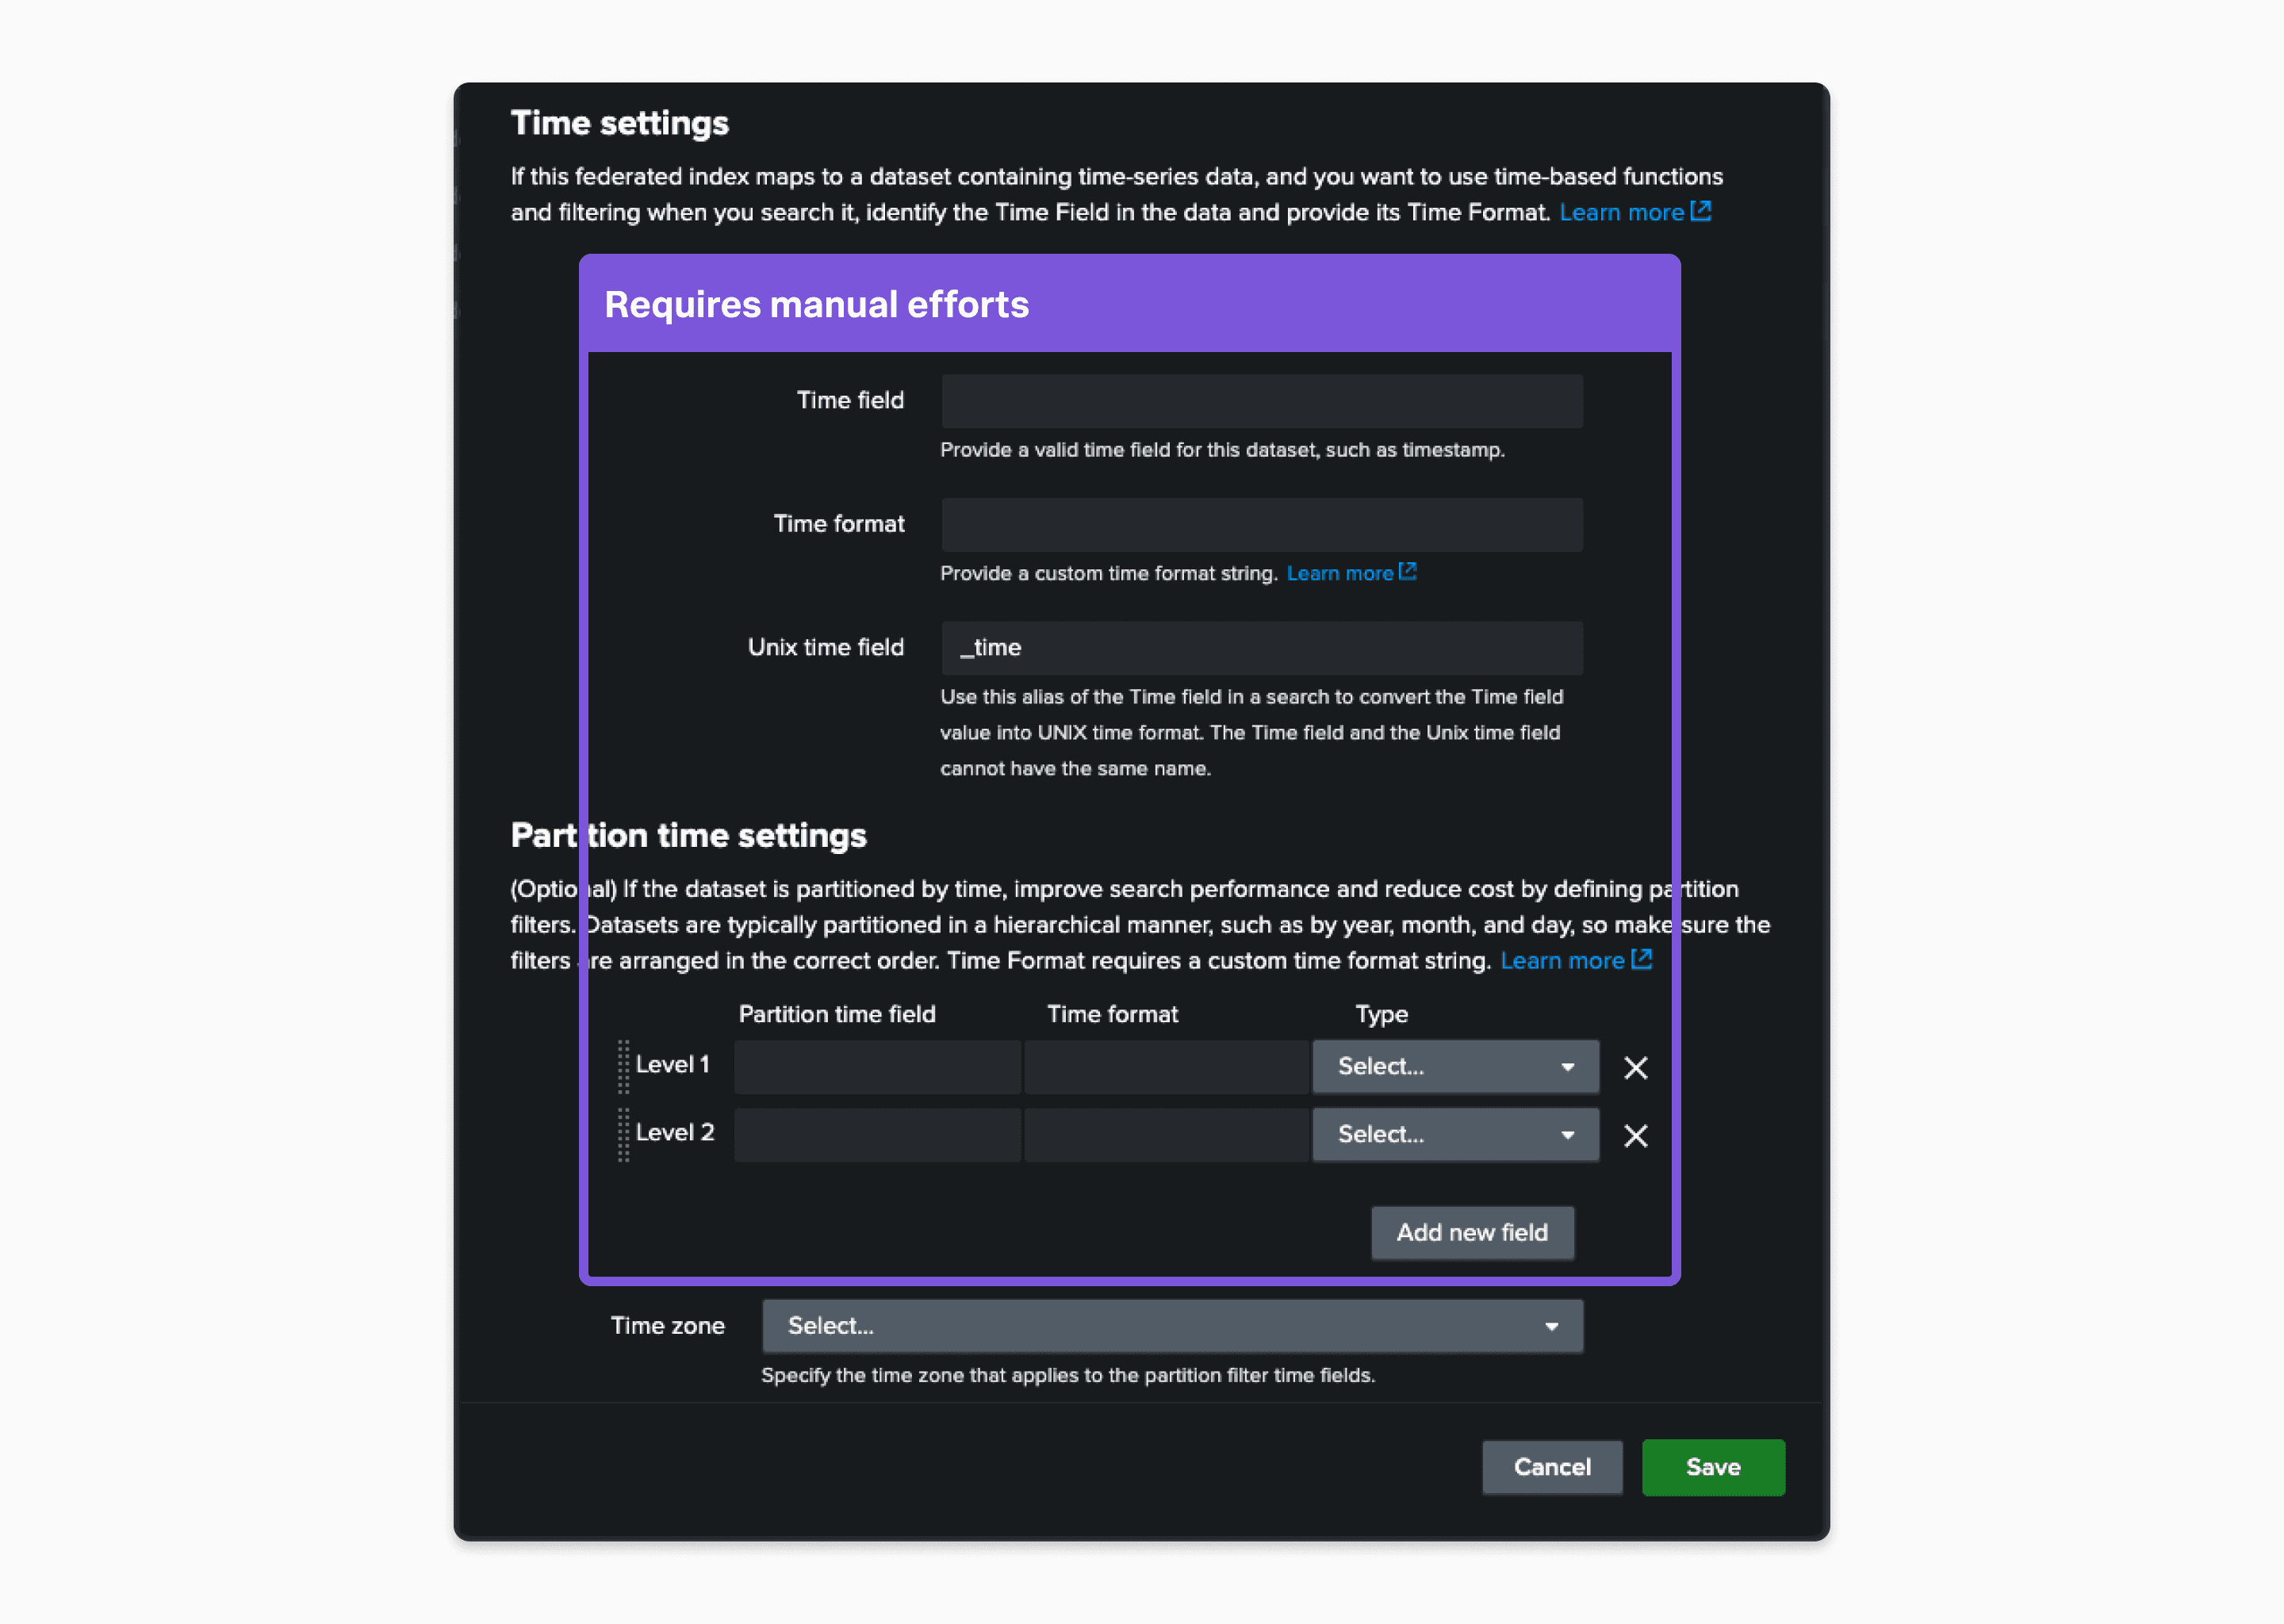
Manual effort increases errors and slows down progress
The configuration requires manual typing and switching between apps to find information, making it both time-consuming and error-prone.
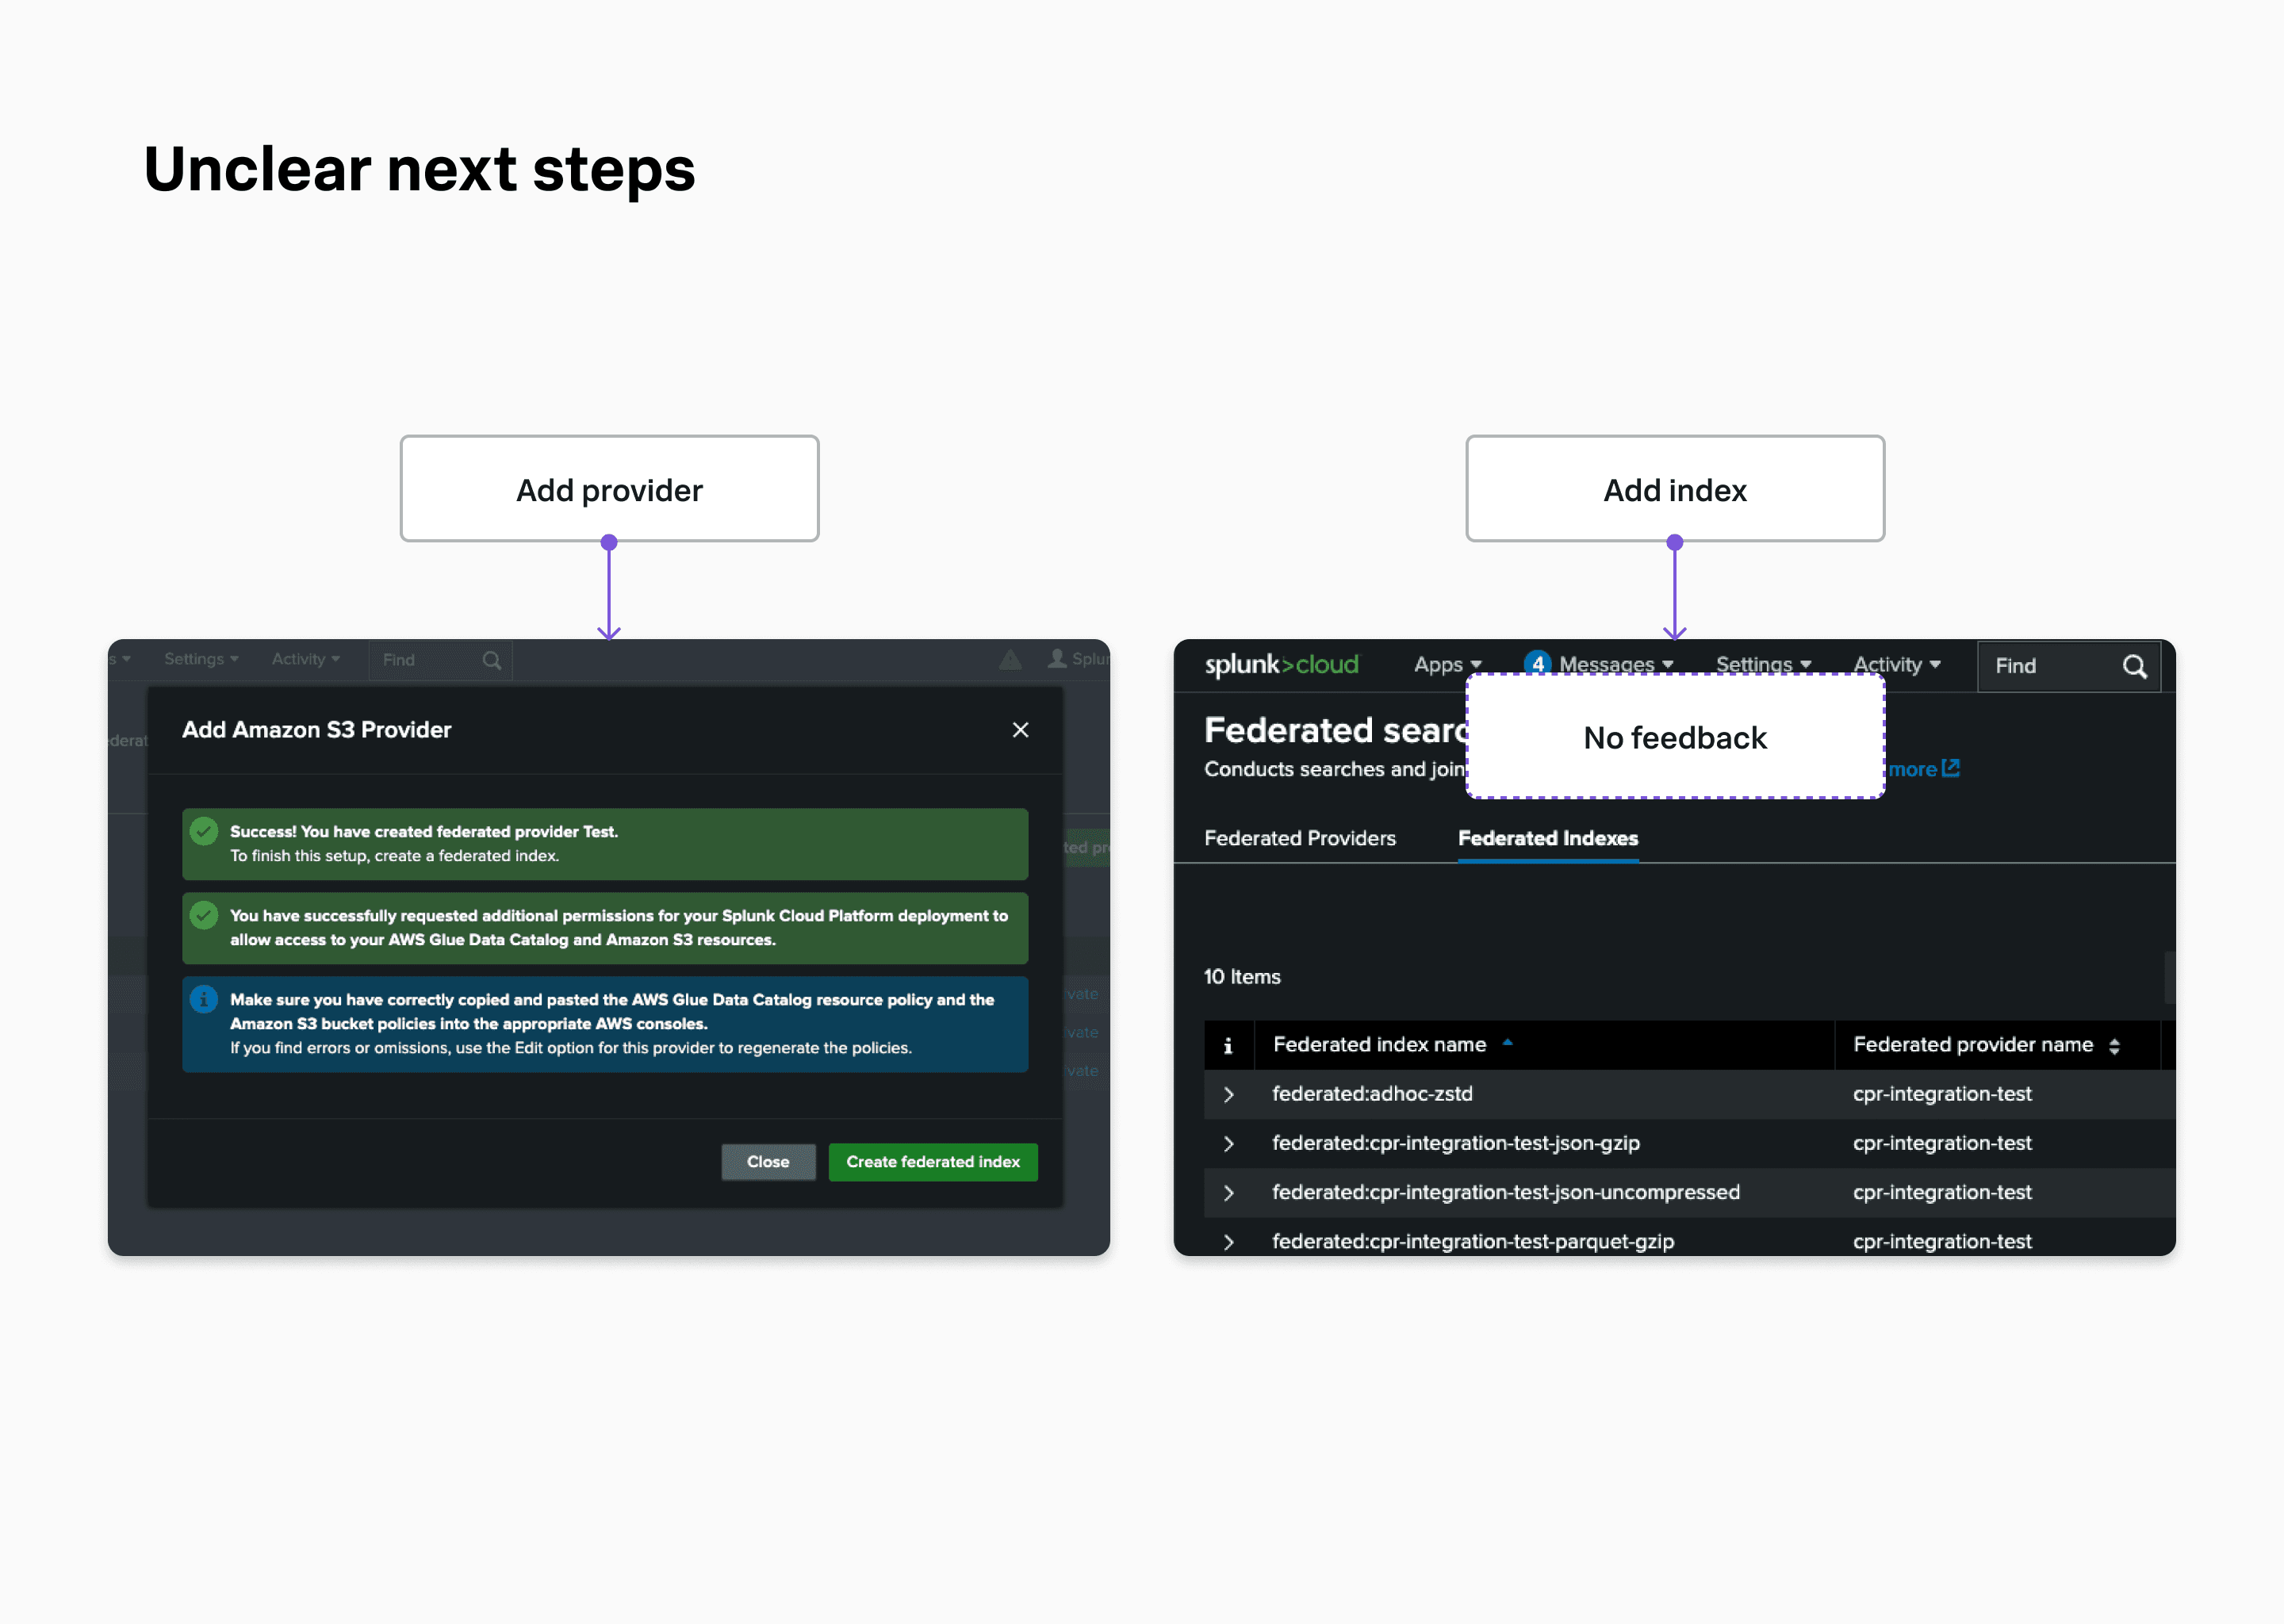
Unclear feedback adds confusion
Lack of clarity on the following actions makes it confusing for users whether the onboarding is successful and what to expect next.
A streamlined flow that expedites the setup process for querying and running analytics on multiple datasets — within the same No. of steps.
Use wizard design to reduce cognitive load
One action button for the combined flow.
Break down the lengthy process into multiple steps to reduce cognitive load.
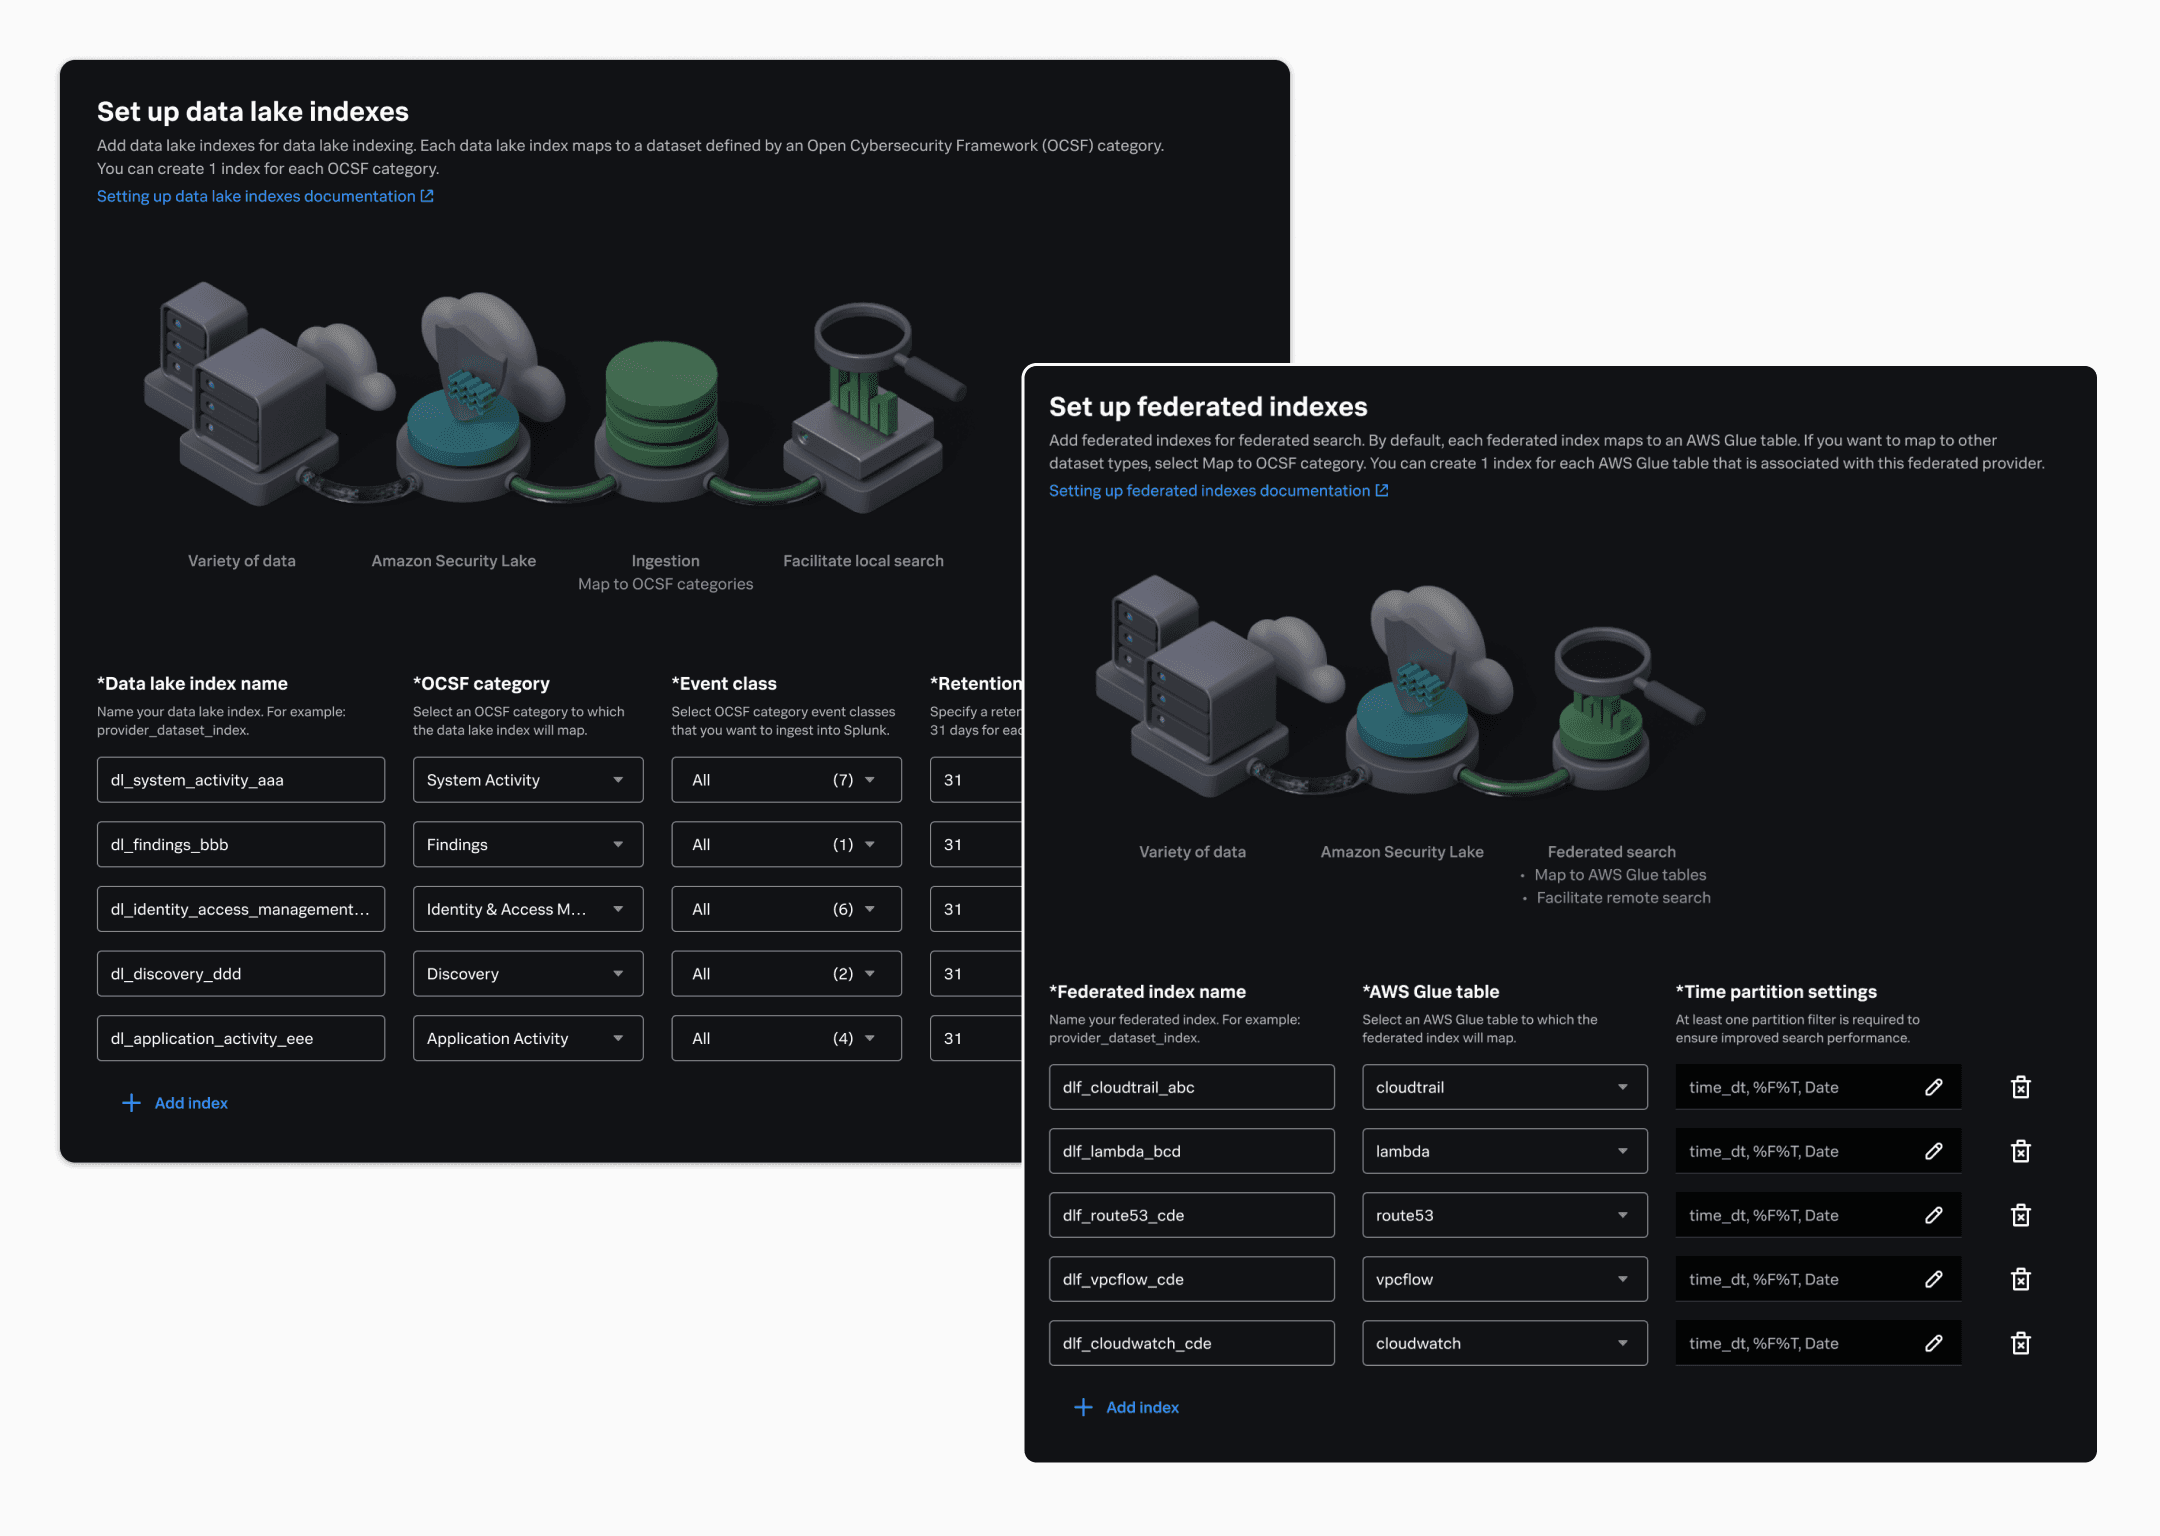
Guided experience to ease the pain of configuration
Step-by-step guidance to help users understand why and how to complete each step.
Additional documentation for further learning purposes.
Built-in automation to expedite the setup process
Enable bulk creation of datasets with auto-mapping and pre-populated values to automate the settings that largely save time and prevent human errors.
Clear indications to make it cohesive
A summary page for comprehensive review.
A feedback page with clear messages to help with following decision making after onboarding.
Solving the main challenges of the new workflow and the user pain points found out from the research study.
Problem 1️⃣
The new onboarding process is non-linear and includes configurations with new terminologies.
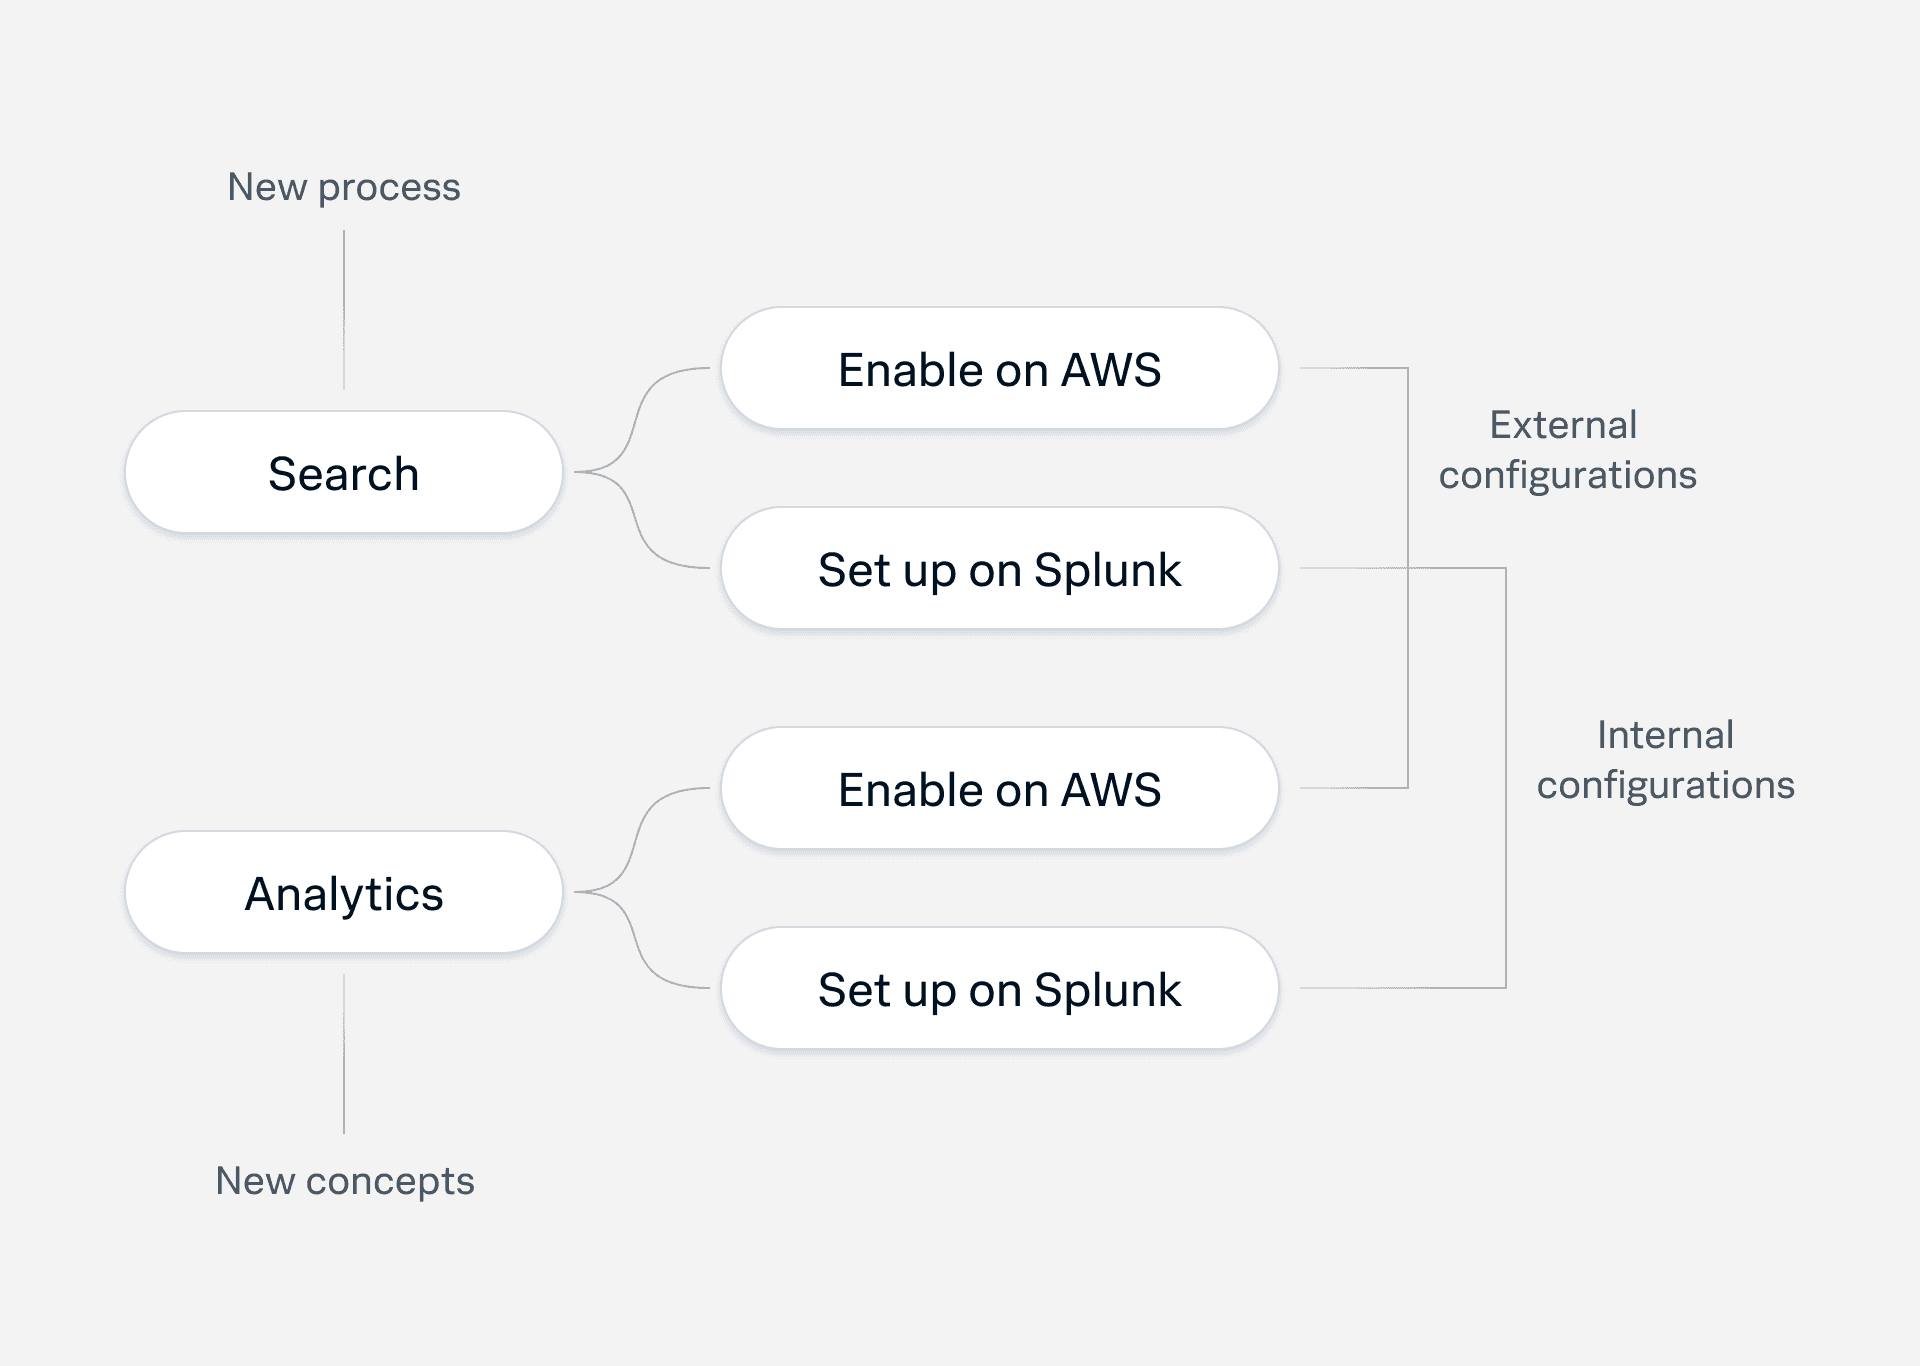
Solution👇
Group the steps by internal/external config to minimize switching between interfaces, prioritizing efficiency.

Problem 2️⃣
Non-expert users cannot fully understand the terminologies for the different data access abilities.

Solution👇
Provide visual aids within context to help users understand the purpose of two data access abilities.
Problem 3️⃣
The back-and-forth communication is unforeseen and can slow down the progress.

Solution 👇
Include high level intro to let users know what to expect and be prepared for the actual setup steps.

Problem 4️⃣
The configuration is an iterative process instead of a one-and-done task.

Solution 👇
A consolidated form for easy editing — edit the settings directly without going through the wizard flow again.

End-to-end
Design

Kick off onboarding
Start the onboarding by adding the Amazon Security Lake as a federated provider.
Connect to data source
A guided flow to help users connect to the external data step-by-step, with clear explanations on what they need to do and why.

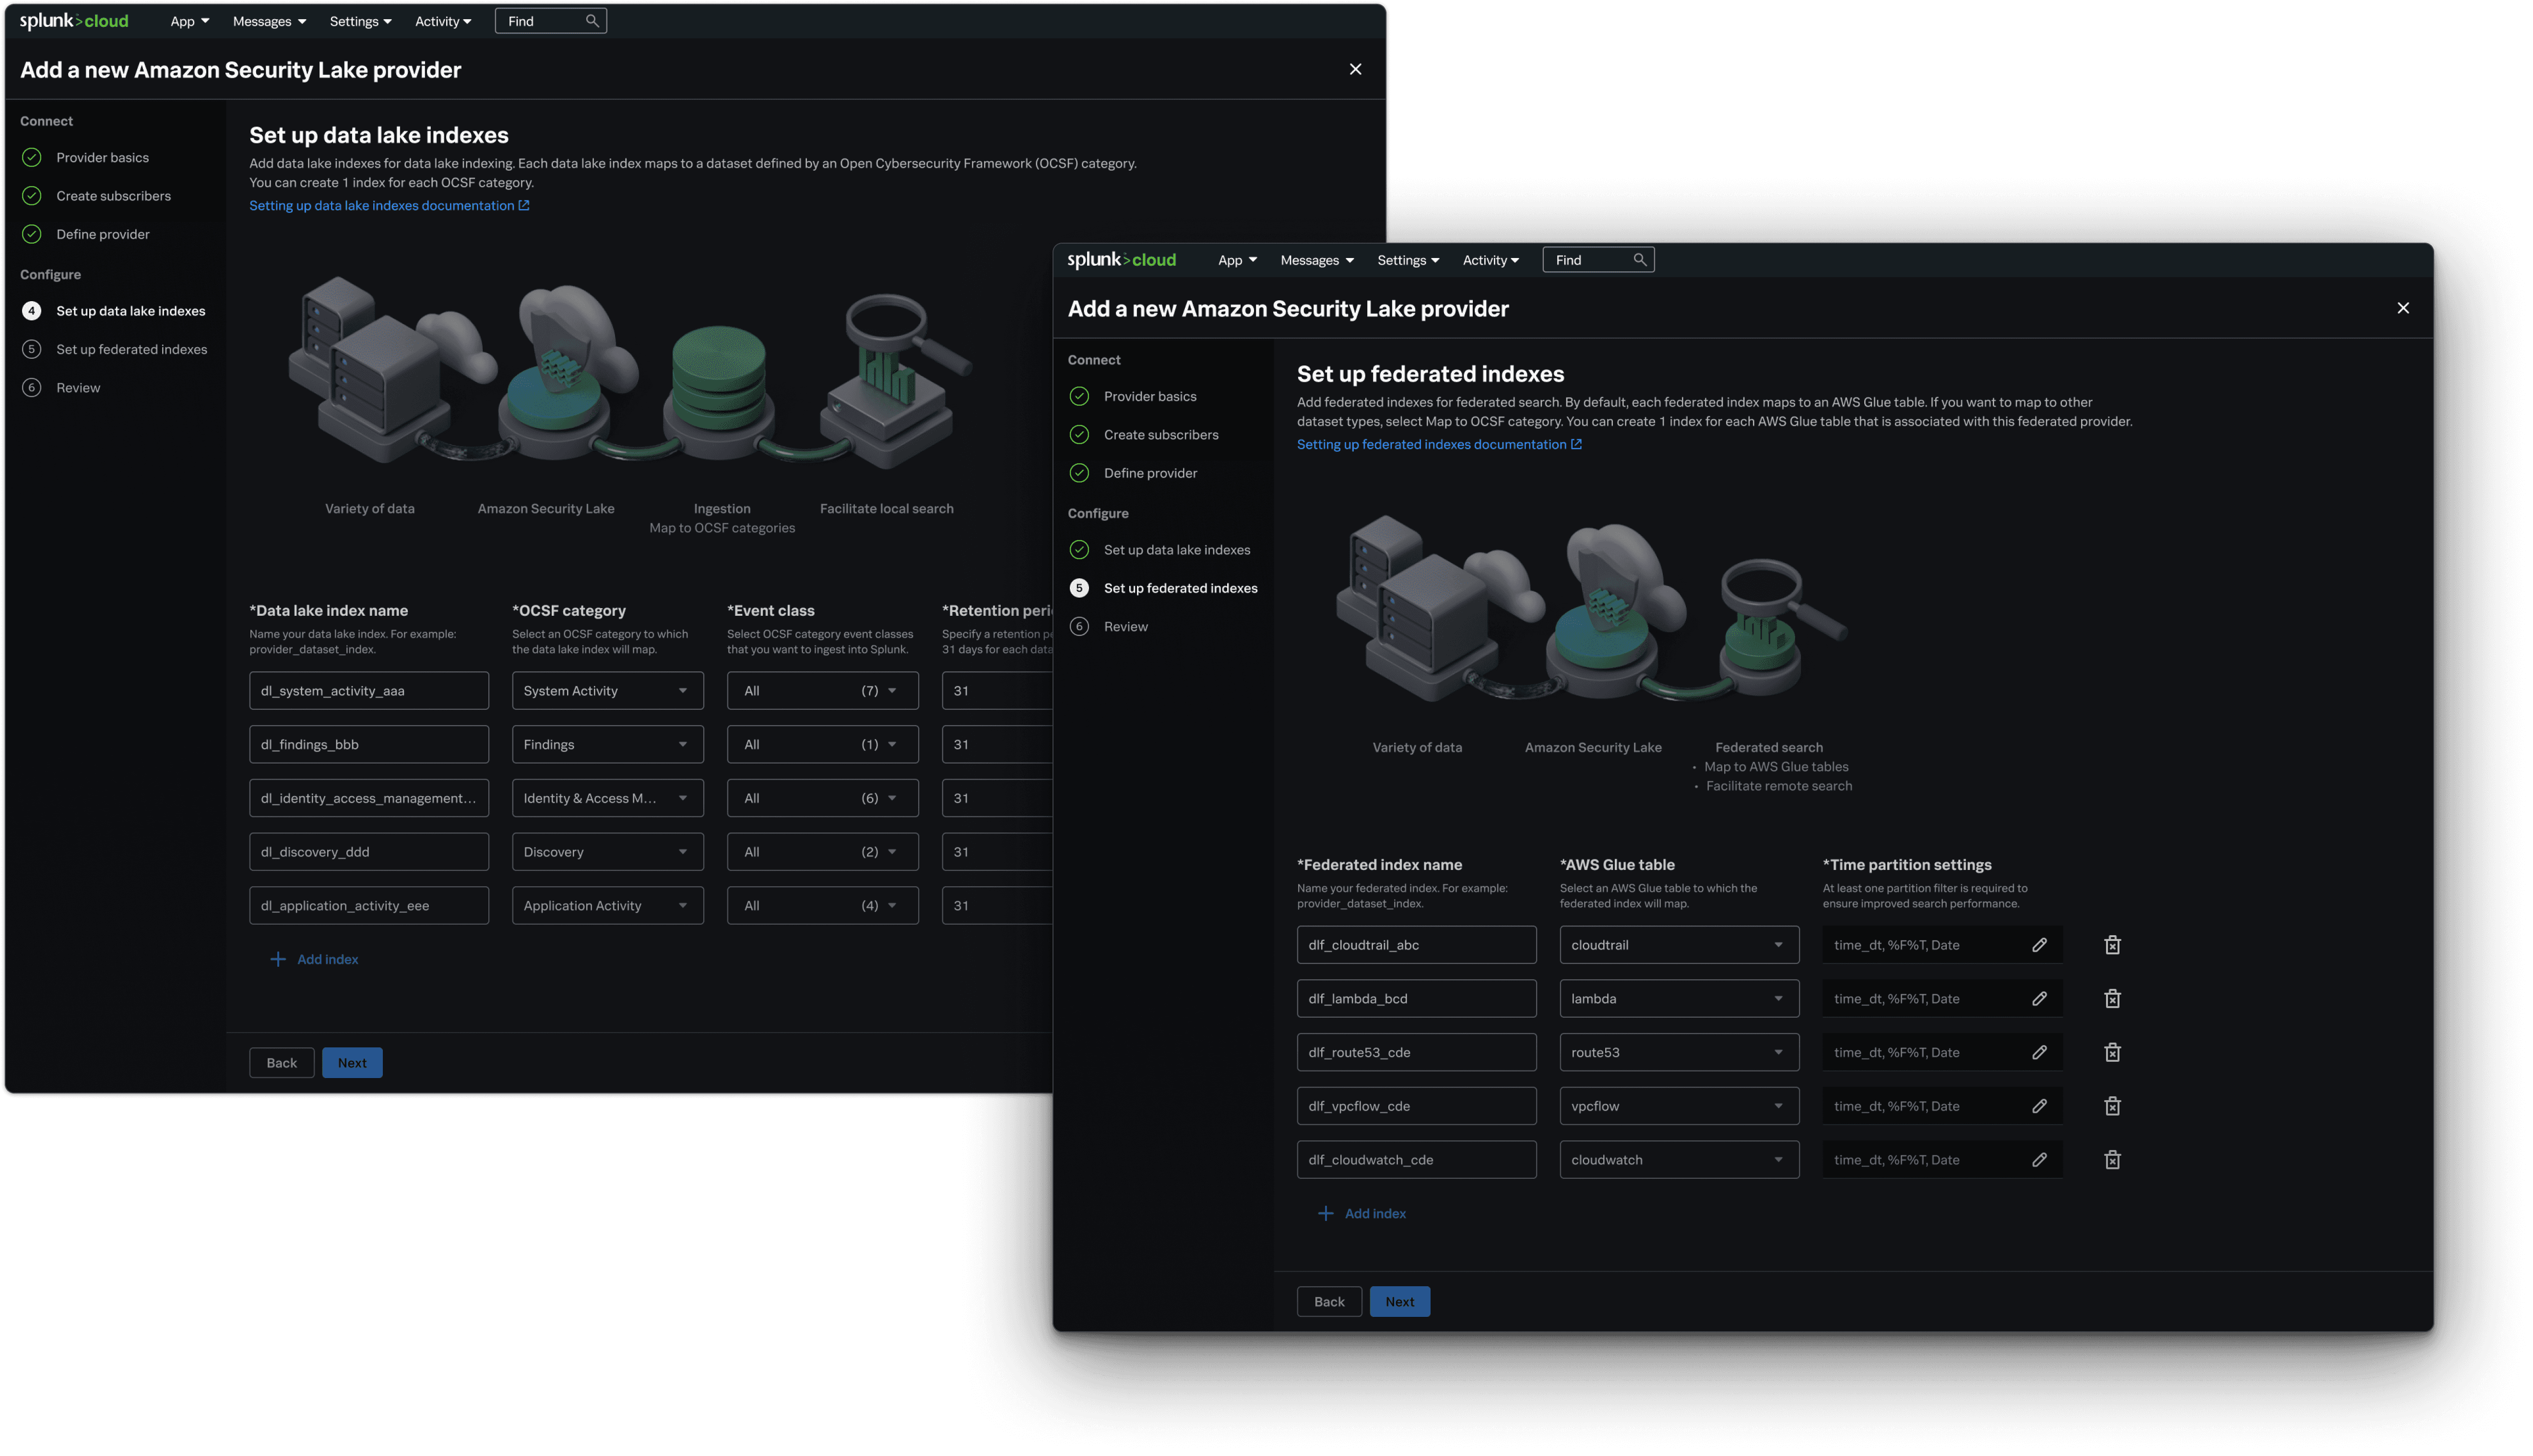
Configure data access
Enable both search and analytics features by setting up two types of index with visual aids and built-in automation.
Complete onboarding
A comprehensive review for the final check and a feedback page to suggest next steps after completing the onboarding.


Edit the configurations
View and edit the configurations in a consolidated 2-step flow.
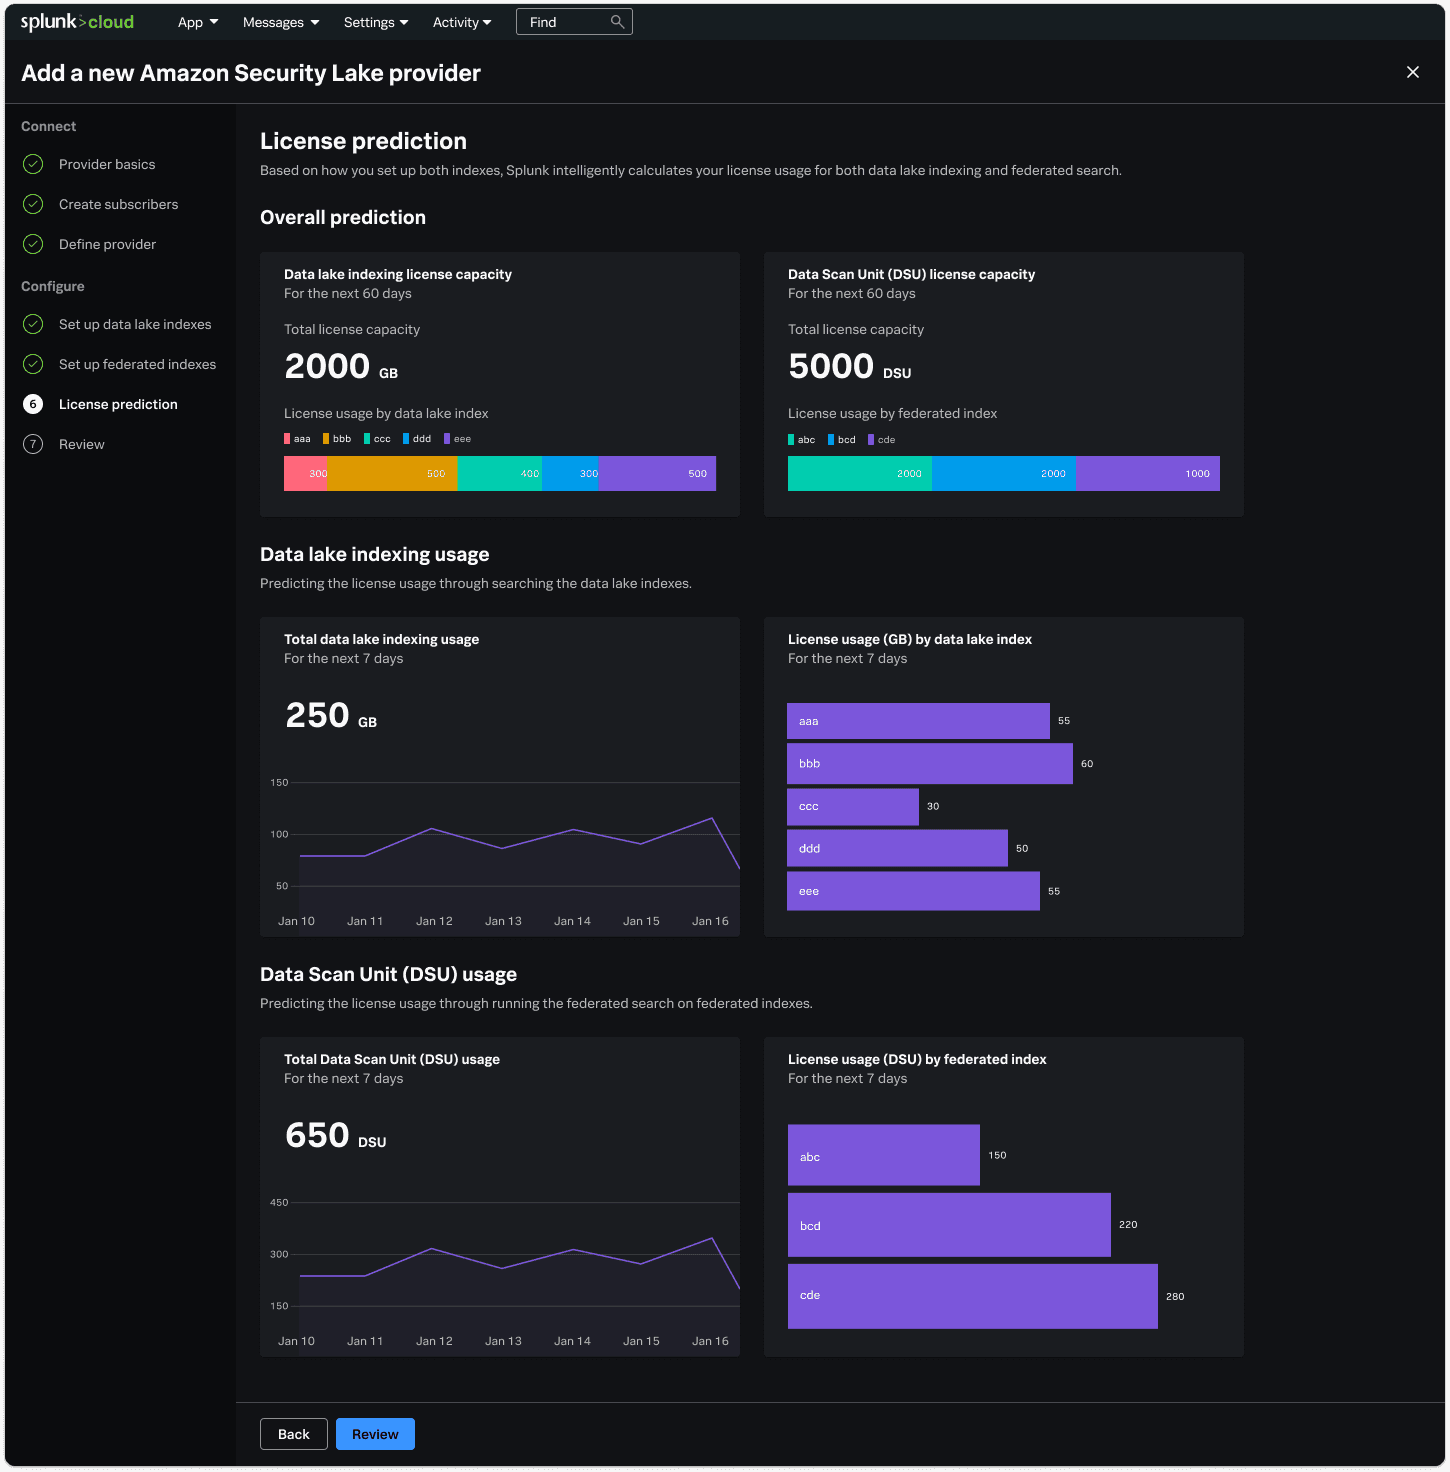
AI-powered license prediction
Cost savings are critical to the users, yet Splunk has not provided an effective way to help them estimate costs before purchasing the license.
Predicting the cost based the data configuration would help the users manage their budgets more effectively. If Splunk could also recommend data filtering strategies to optimize costs, this would be a huge win.
📂 Business impact
🔓 Enables analytics on distributed data without full ingestion.
🔔 Highlighted at the product keynote at Splunk's annual conference, receiving customer interest from 10 companies.
💪 Strengthens Splunk's leadership in security analytics by enabling the first integration with a security data lake.
🙎🏻 User impact
⏩ Faster time to value: One single workflow to configure for both querying and analytics across multiple datasets.
🙌 Achieves 5 more use cases by running analytics on distributed data.
💗 Good usability with an average test score of 80, measured by the EASE metrics.